The 2021–2022 Press Freedom Crisis: A Crisis Without Sub-Indicator Data
Between 2021 and 2022, global press freedom underwent its sharpest single-year decline in over a decade of RSF data. But the sub-indicator breakdown that would explain why isn’t there for that year. Using RSF’s own thematic reporting, the pressfreedom.data package, and some maps, this post reconstructs what happened — and admits what it can’t show.
pressfreedom.data
analysis
journalism
RSF
Author
Peter Baumgartner
Published
August 30, 2026
Modified
August 30, 2026
Peter Baumgartner
The steepest single-year drop I’ve seen in this data
The previous post looked at the 25-year arc behind RSF’s 2026 Index — a gradual, decade-long decline punctuated by two sharp step-downs. This post zooms into the first and steeper of those two: 2021→2022.
While preparing pressfreedom.data — an R package I’ve been building that consolidates Reporters Without Borders (RSF) press freedom rankings from 2002 through 2026 — one year kept catching my attention every time I plotted the trend: 2022. Not because it was the worst year on record, but because of how fast it got there. The world average score fell by roughly 6.7 points between 2021 and 2022 — the sharpest single-year decline anywhere in the whole series I’ve assembled.
Normally, when a number like that shows up, my first move is to open RSF’s sub-indicators: political context, economic context, legal context, social context, and journalist safety. Each of those is scored separately and rolled up into the overall score, so decomposing a change is usually a matter of asking which dimension moved the most. That’s exactly the analysis I’ll do for the following year’s decline in the next post.
For 2021→2022, that option isn’t available. RSF’s published data for that year doesn’t include the five sub-indicator scores — only the aggregate. I don’t know why; it might be a reporting gap, a methodology transition, or simply a file I haven’t found yet. Whatever the reason, it means I can’t answer “which dimension broke?” with the data alone. What I can do is look at where the decline hit hardest, and read it against RSF’s own contemporaneous account of what was happening in journalism that year. That’s what this post does.
The data behind this analysis
Every year, RSF publishes its press freedom rankings as a fresh CSV, and every year the column names, category labels, and even some country-name spellings shift slightly. Reconciling 24 years of that into one analyzable table was a project of its own — I’ve written about the encoding problems (Encoding Resilience), the judgment calls involved in cleaning it (When Data Cleaning Becomes Decision-Making), and the pipeline I eventually built to keep it updated without redoing the work by hand every year (Automation versus Judgment Calls).
The result is pressfreedom.data, an R package with one standardized table, rwb_standardized, covering 2002–2026 across roughly 180 countries a year. Every figure in this post is generated directly from that table — no manually copied numbers, no separate spreadsheet.
I’ve also put together a companion Shiny app for exploring the same data interactively: trends by zone, drill-downs into individual countries, and a data export if you want to run your own analysis. If a claim in this post looks surprising, that’s the place to check it against the raw numbers.
Where 2021→2022 sits in the longer 2013–2026 trend — a sudden step down against an otherwise gradual slide — is covered with a chart in the previous post; I won’t repeat it here. What matters for this post is why that step, specifically, is harder to explain than the data alone can support.
Why 2021 has no sub-indicators: the 2022 methodology overhaul
The gap in the data isn’t a filing error or a column I’ve failed to locate — it’s structural. RSF’s 2022 Index was the 20th edition, and it came with the most significant methodology change in the series’ history. Working with a panel of seven outside experts from academia and the media sector, RSF replaced the framework it had used since 2013 — seven criteria covering pluralism, media independence, self-censorship, legislative framework, transparency, infrastructure, and abuses — with a new one built around five indicators: political context, legal framework, economic context, sociocultural context, and safety. Each indicator is scored on its own 0–100 scale and combined into the overall score.
This wasn’t a relabeling exercise. RSF paired the new structure with a new working definition of press freedom itself: the effective possibility for journalists, individually and collectively, to select, produce, and disseminate information in the public interest, free from political, economic, legal, and social interference, and without threats to their physical and mental safety. Each of the five indicators maps onto one clause of that definition, which is a more deliberate design than the older seven-criteria list it replaced.
The scoring mechanics changed too. Every country’s indicators are built from two components: a quantitative tally of press-freedom abuses and violations tracked directly by RSF throughout the year, and a qualitative survey — a questionnaire of over 120 questions, translated into more than 20 languages, answered by hundreds of RSF-selected press freedom specialists (journalists, academics, and human rights defenders) in each country. The safety indicator in particular leans heavily on the quantitative side: roughly two-thirds of that score comes directly from tallied abuses — violence, imprisonment, and similar attacks against journalists — rather than from the survey.
The practical consequence for this post is straightforward: the five sub-indicators didn’t exist as a data structure before the 2022 Index. RSF’s public files for 2021 and every prior year simply don’t have political-context, economic-context, legal-context, social-context, or safety columns to report, because those categories weren’t invented yet. It’s not that RSF collected the breakdown for 2021 and withheld it, or that I’m missing a file — the five-indicator decomposition is a genuinely new measurement, first applied to the 2022 Index. That means 2022 is the earliest year in the whole pressfreedom.data table where a sub-indicator decomposition is even possible, which is exactly the analysis the next post can do for 2023→2024 but this one can’t do for 2021→2022.
It also means comparisons across the methodology boundary need some caution. RSF itself flags that its own comparative analysis across the Index’s 25-year history “spans several methodology changes,” and the 2022 overhaul is the largest of them for this series. The overall 0–100 score is reasonably continuous across the transition — the 6.7-point drop I opened with is a real, comparable number — but the composition of that score, and any explanation of why it moved, is only available from 2022 onward.
RSF’s account: an “era of polarization”
Without sub-indicators, the best source I have for why is RSF’s own thematic reporting from that year. RSF framed 2022 as a turning point, characterized by a shift from the slower institutional and economic pressures of prior years toward something closer to active information conflict. Four themes run through their reporting:
Information chaos. Unregulated online spaces let disinformation spread largely unchecked, and RSF pointed specifically to the United States and France as places where internal political polarization fed into, and was fed by, a fractured media landscape. The effect wasn’t censorship in the classical sense — it was an erosion of shared, trusted sources of information.
Authoritarian weaponization of information. Russia’s invasion of Ukraine was preceded by, and accompanied by, an intensified domestic propaganda effort, and RSF described a broader pattern of authoritarian states treating controlled information as a strategic tool rather than a purely domestic control mechanism. China’s tightening was framed in similar terms.
Consolidation inside “illiberal democracies.” RSF pointed to Poland as a model case: public broadcasting brought under direct government influence, pressure applied to private outlets. A record number of countries — 28, by RSF’s count — were placed in the “very bad” category that year, a threshold meant to flag not just autocracies but democracies using legal and administrative tools against the press.
Social media as amplifier. RSF’s framing put some of the blame on platform incentives that reward divisive content, plus the rise of openly partisan “opinion media” that blurs the line between journalism and advocacy. Both trends, in their account, increase pressure and harassment aimed at individual journalists.
Taken together, RSF’s own explanation for 2022 isn’t a single cause — it’s several distinct mechanisms operating at once: geopolitical conflict, domestic authoritarian consolidation, and polarization within democracies that never had an authoritarian government to begin with. That distinction matters, because those three mechanisms don’t hit the same places.
Where the decline actually landed
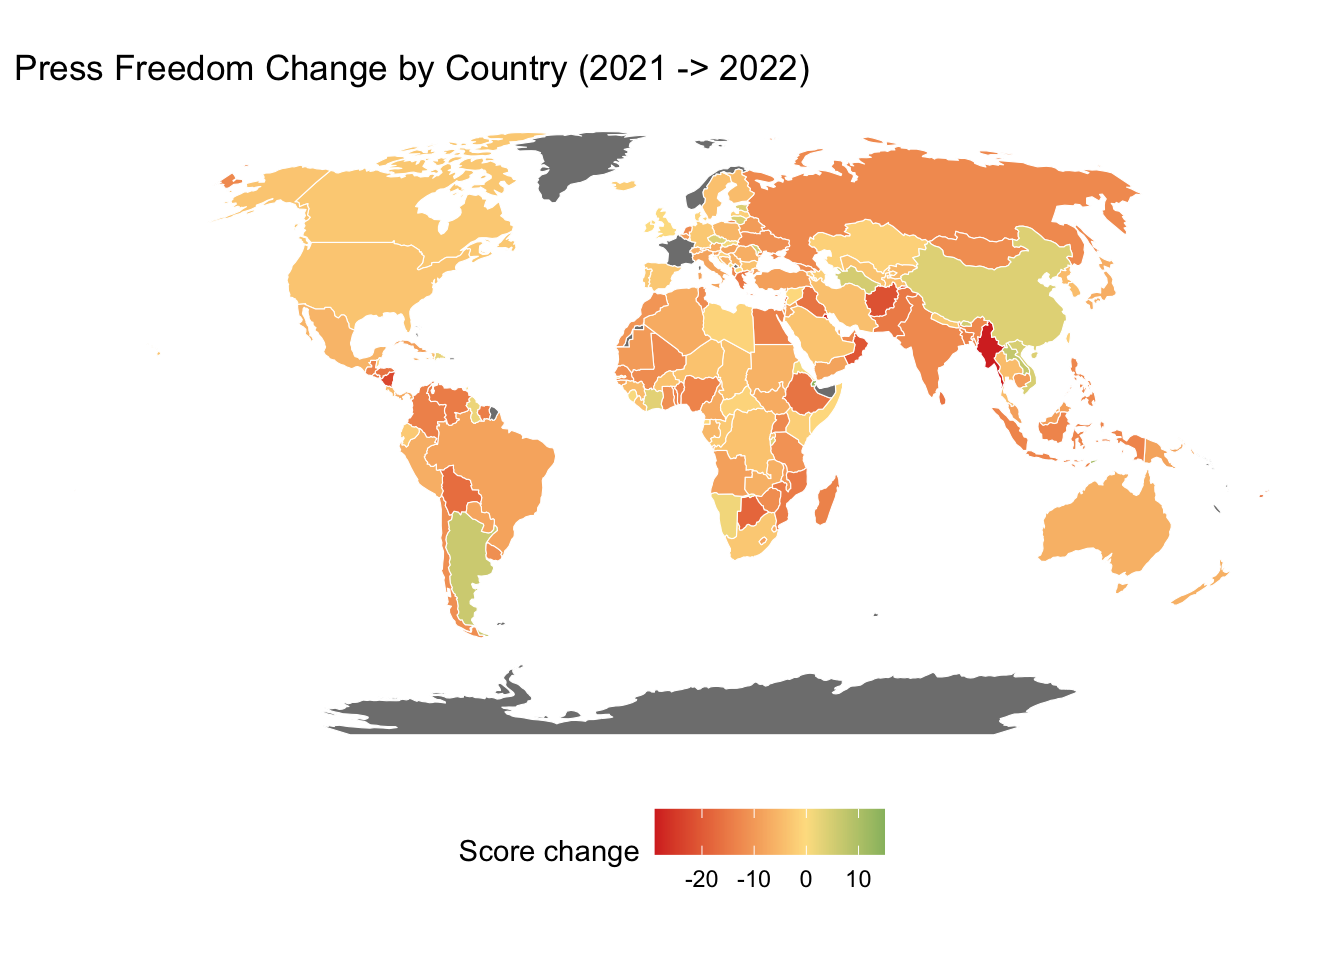
RSF’s narrative can be checked against where the scores actually moved. Of the 180 countries with complete 2021 and 2022 data, 151 (about 84%) declined and 29 improved.
Figure 1: Press freedom score change by country, 2021→2022. Red indicates decline, green indicates improvement. Eastern Europe and Central Asia, and the Middle East and North Africa, show the most concentrated red.
zone_changes<-change_2021_2022|>group_by(zone)|>summarise(n =n(), mean_change =mean(score_change), .groups ="drop")|>arrange(mean_change)ggplot(zone_changes, aes(x =mean_change, y =reorder(zone, mean_change), fill =mean_change<0))+geom_col(color ="white", linewidth =0.5)+geom_vline(xintercept =0, color ="gray30", linewidth =0.4)+scale_fill_manual(values =c("TRUE"="#d73027", "FALSE"="#1a9850"), guide ="none")+labs( title ="Average Press Freedom Change by Zone (2021-2022)", x ="Average score change", y =NULL)+theme_minimal()
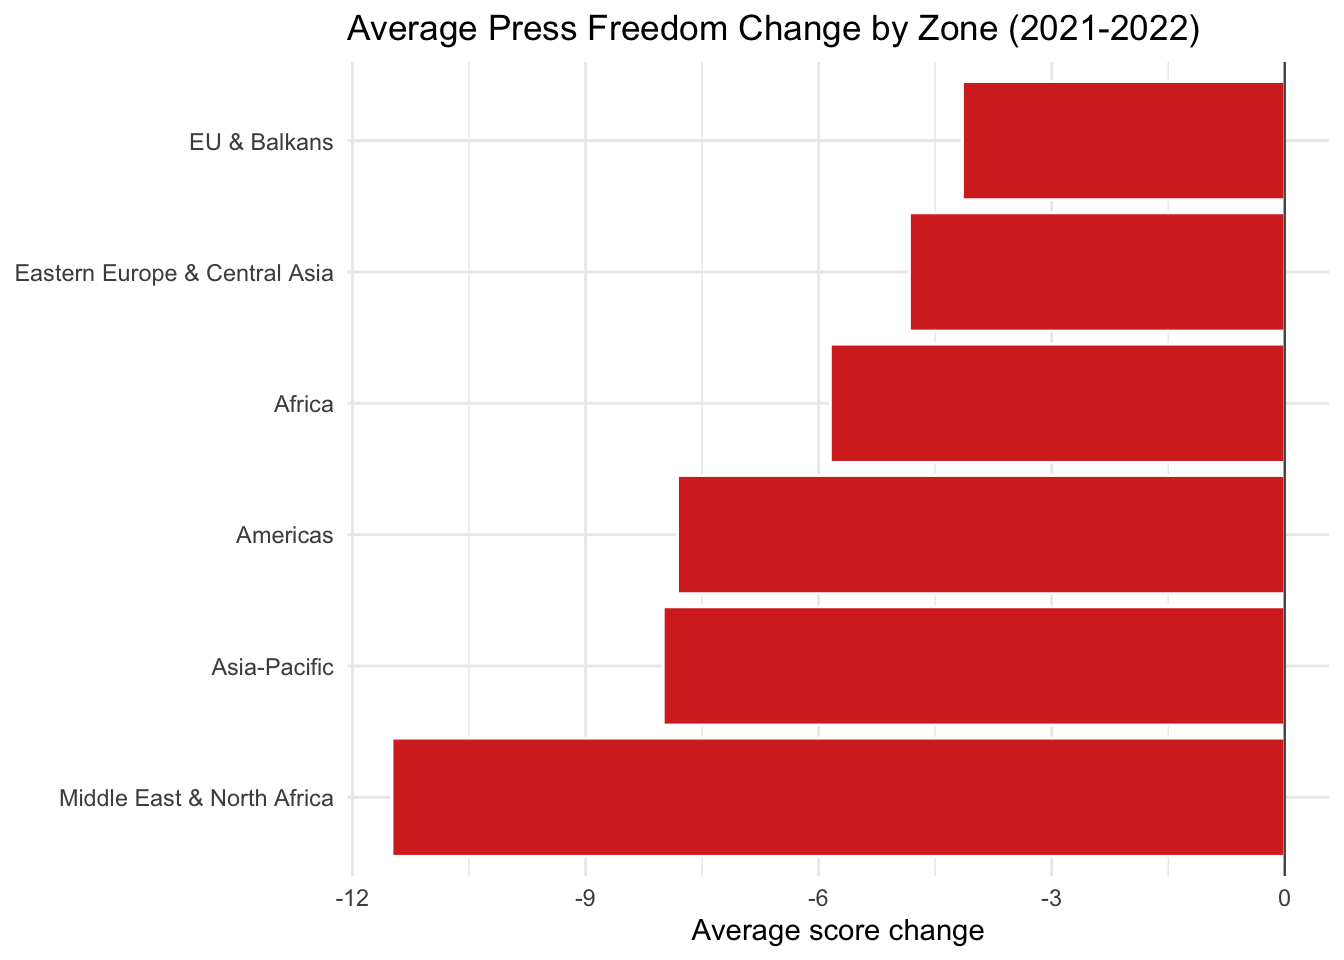
Figure 2: Average press freedom score change by zone, 2021→2022. Middle East and North Africa shows the steepest average decline; EU and Balkans is the most resilient — but every zone declines on average.
The map and the bar chart tell a consistent story, and it maps reasonably well onto RSF’s four themes — though not in a one-to-one way:
Middle East & North Africa had the steepest average decline (−11.5 points across 19 countries) — but this region was already the world’s lowest-scoring, so the decline compounds an existing crisis rather than representing a new one. Palestine (−27.8) and Kuwait (−27.8) are the most severe individual cases.
Asia-Pacific shows the widest spread: Myanmar (−28.8, the largest decline anywhere, following the 2021 military coup), Hong Kong (−27.9, national security law enforcement), and Afghanistan (−21.5, the Taliban takeover) sit alongside countries with no meaningful change at all.
Eastern Europe & Central Asia declined by a more moderate −4.8 points on average, but that average hides the fact that the states most closely tied to Russia’s political orbit tightened control substantially in the months following the invasion of Ukraine.
EU & Balkans was the most resilient zone (−4.1 average) — but “resilient” doesn’t mean unaffected. A handful of member states continued a slower erosion already underway before 2022.
Africa was the most internally variable zone: Botswana declined sharply (−18.3) while Djibouti (+14.4) and Seychelles (+9.0) posted the two largest improvements anywhere in the dataset.
Of the 29 countries that improved, most were smaller states going through post-election stabilization or institutional consolidation — Argentina (+6.3) is the largest exception among bigger democracies.
Three different crises wearing one number
What strikes me most about lining up the map against RSF’s narrative is that “press freedom declined in 2022” is doing a lot of work to describe at least three distinct situations:
Geopolitical conflict (Eastern Europe & Central Asia, and parts of Asia): the Ukraine invasion and its ripple effects — tightening control in Russia’s sphere, direct threats to journalist safety in and around conflict zones.
Democratic backsliding through legal and administrative tools (Central Europe, parts of the Americas): governments using existing democratic institutions — broadcasting regulation, defamation law, advertising allocation — to squeeze independent media without overt censorship.
Internal polarization without direct state action (the United States, France, and similarly fractured media environments): a more diffuse process where trust in journalism erodes from fragmentation and hostility between audiences, not from a government decision.
These aren’t the same problem, and I’d guess they don’t respond to the same interventions. A press freedom index that reports “−6.7 points” globally is accurate, but it flattens three different mechanisms into one number — which is exactly why RSF’s own qualitative reporting matters as much as the score itself.
What the missing data actually costs us
To be explicit about the limitation here: for 2022, RSF’s public data gives me the aggregate score and nothing beneath it. I don’t know whether the decline was driven primarily by political repression, economic starvation of independent media, legal restriction, social hostility, or direct threats to journalist safety — most likely, given the range of stories above, some mix of all five. What I’ve done in this post is infer plausible mechanisms from RSF’s qualitative reporting and match them against where the decline occurred geographically. That is not the same as measuring which dimension moved.
The next post picks up the 2023→2024 decline, where the sub-indicator data is complete, and asks the same question with tools that can actually answer it: decomposition and regression across five measured dimensions. It’s a genuinely different kind of crisis — and having the fuller data makes that visible in a way this post’s data can’t.
Exploring further
If you want to check any of this against the underlying numbers, the Shiny app lets you drill into individual countries and zones interactively, and the pressfreedom.data package has the full standardized table if you’d rather run your own analysis. All the code producing the figures above is embedded in this post’s source.
2021→2022 was the point where the slow, decade-long decline in press freedom turned into something with a sharper edge — a mix of geopolitical conflict, democratic backsliding, and polarization that a single global average necessarily obscures. What happened next, in 2023–2024, looked different again.