The 2023–2024 Press Freedom Decline: When Governments Attack the Press
A second sharp decline in press freedom, two years after the last one — but this time with complete sub-indicator data. Decomposition points to political hostility as the clear driver of the year-over-year drop. Regression tells a different story about what structurally matters most. Both are correct, and reconciling them is the point of this post.
pressfreedom.data
analysis
journalism
RSF
Author
Peter Baumgartner
Published
August 31, 2026
Modified
August 30, 2026
Peter Baumgartner
A second crisis, four years apart, with better data this time
The last post covered the sharpest single-year decline in the pressfreedom.data series, 2021→2022, and admitted a limitation: RSF’s data for that year has no sub-indicator breakdown, so I could describe where the crisis hit but not measure which dimension drove it. That post’s crisis was, by RSF’s own account, about information chaos and geopolitical conflict.
Two years later, another sharp decline shows up in the same trend line — and this time the five sub-indicators (political, economic, legal, social, and safety) are all there for 2022 through 2026. That changes what kind of question I can ask. Instead of inferring mechanisms from qualitative reporting, I can decompose the change directly: which of the five measured dimensions actually moved?
Decomposing the 2023→2024 drop
For each zone and the world, I take the mean of each sub-indicator in 2023 and again in 2024, then look at the year-over-year change.
library(tidyverse)library(pressfreedom.data)data(rwb_standardized)decomp_data<-rwb_standardized|>filter(year_n%in%c(2023, 2024))|>select(year_n, zone, political_context, economic_context,legal_context, social_context, safety)|>drop_na()|>group_by(year_n, zone)|>summarise(across(everything(), mean), .groups ="drop")world_decomp<-decomp_data|>group_by(year_n)|>summarise(across(-zone, mean), .groups ="drop")|>mutate(zone ="World")decomp_data<-bind_rows(decomp_data, world_decomp)change_data<-decomp_data|>pivot_longer(-c(year_n, zone), names_to ="indicator", values_to ="value")|>pivot_wider(names_from =year_n, values_from =value, names_prefix ="year_")|>mutate(change =year_2024-year_2023)|>mutate( indicator =factor(indicator, levels =c("political_context", "economic_context", "legal_context","social_context", "safety"), labels =c("Political", "Economic", "Legal", "Social", "Safety")), zone =factor(zone, levels =c("World", sort(unique(zone[zone!="World"])))))ggplot(change_data, aes(x =indicator, y =change, fill =zone))+geom_col(position ="dodge", color ="white", linewidth =0.3)+geom_hline(yintercept =0, color ="gray30", linewidth =0.4)+scale_fill_manual( values =c("World"="#000000", "Africa"="#E69F00", "Americas"="#56B4E9","Asia-Pacific"="#009E73", "EU & Balkans"="#F0E442","Middle East & North Africa"="#D55E00","Eastern Europe & Central Asia"="#CC79A7"))+labs( title ="Change in Press Freedom Sub-Indicators (2023 -> 2024)", x ="Sub-Indicator", y ="Change in score", fill ="Zone")+theme_minimal()+theme(legend.position ="bottom", legend.box ="vertical")
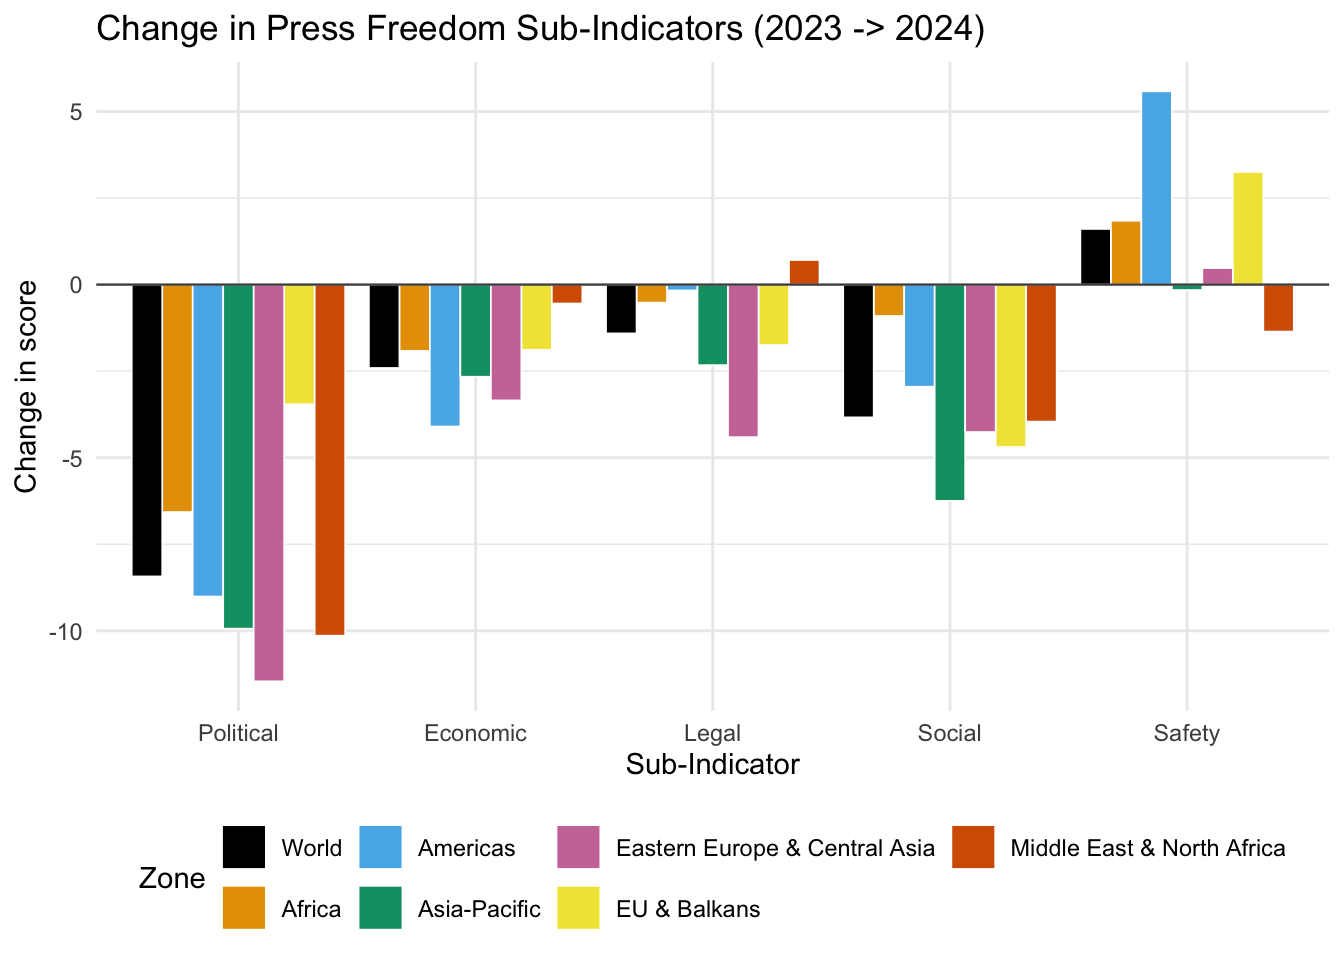
Figure 1: Change in press freedom sub-indicators, 2023→2024, by zone. Political context shows the steepest and most consistent decline; safety is the only dimension with net improvements in most zones.
The pattern is unambiguous in a way the 2021–2022 map never quite was: political context fell furthest, in nearly every zone. The world average political score dropped 8.4 points — more than double the drop in any other dimension. Eastern Europe & Central Asia (−11.5) and the Middle East & North Africa (−10.1) show the steepest political declines; even the EU & Balkans, the most stable zone throughout this series, lost 3.5 points.
Safety moves in the opposite direction. The world average actually rose slightly (+1.6), driven by improvements in the Americas (+5.6) and EU & Balkans (+3.3). Africa and Eastern Europe & Central Asia also improved modestly. Only the Middle East & North Africa (−1.4) and Asia-Pacific (−0.2) saw safety decline, and only slightly. Economic, legal, and social context show smaller, more mixed changes across zones — none approaching the size of the political decline.
Three named developments in RSF’s reporting for this period line up with the political-context finding: a wave of government hostility toward the press in countries not usually flagged as authoritarian, 2024’s status as the largest global election year on record (elections tend to sharpen pressure on journalists before and after the vote), and continued spread of “foreign agent” style legislation from Russia into neighboring states. None of that is a substitute for the decomposition above, but it’s consistent with it.
A few individual countries illustrate the pattern concretely. Argentina’s rank fell from 40th to 66th (score down 10.3 points) following its change in government; the United States fell from 45th to 55th (score down 4.6); Italy fell from 41st to 46th (score down 2.2). None of these are conflict zones or authoritarian states — they’re established democracies where RSF’s political-context indicator specifically registered deterioration.
What matters structurally is a different question
Decomposition answers “what changed the most this year?” A separate question is “which dimension matters most to the overall score, structurally, across many country-years?” That’s a regression question, not a year-over-year one.
library(broom)reg_data<-rwb_standardized|>filter(year_n>=2022, year_n<=2026)|>select(score, political_context, economic_context, legal_context,social_context, safety)|>drop_na()reg_std<-reg_data|>mutate(across(everything(), ~as.numeric(scale(.))))model_std<-lm(score~., data =reg_std)coef_tidy<-tidy(model_std)|>filter(term!="(Intercept)")|>mutate( term =factor(term, levels =c("political_context", "economic_context", "legal_context","social_context", "safety"), labels =c("Political", "Economic", "Legal", "Social", "Safety")))|>arrange(desc(abs(estimate)))ggplot(coef_tidy, aes(x =estimate, y =reorder(term, abs(estimate))))+geom_col(fill ="#56B4E9", color ="white", linewidth =0.5)+geom_errorbar(aes(xmin =estimate-std.error, xmax =estimate+std.error), width =0.2, color ="gray40", linewidth =0.4)+labs( title ="Standardized Regression Coefficients (2022-2026)", x ="Standardized coefficient", y =NULL, caption ="Error bars show ±1 standard error")+theme_minimal()
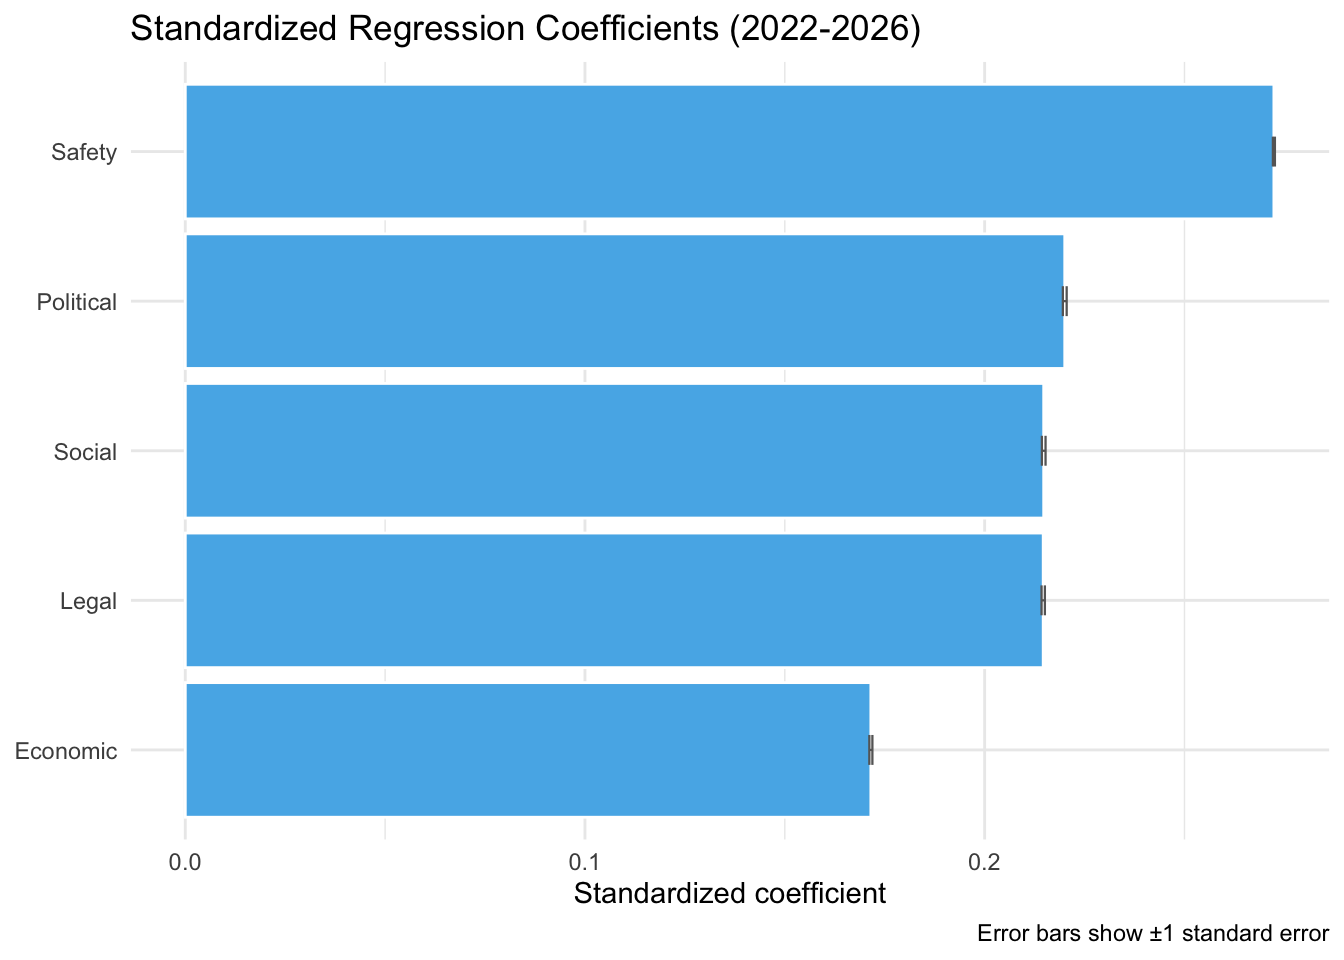
Figure 2: Standardized regression coefficients from a model of overall score on the five sub-indicators, using all country-years from 2022–2026 with complete data (n = 900). Safety has the largest coefficient, followed by political context.
Using all country-years from 2022–2026 with complete data (n = 900), safety has the largest standardized coefficient (β = 0.272), followed by political context (β = 0.220), with social and legal context close behind (β ≈ 0.215 each) and economic context lowest (β = 0.172). Looking at partial R² — the unique variance each dimension explains after controlling for the other four — the gap widens further: safety alone accounts for 3.2% of the model’s variance, more than the other four dimensions combined (political context contributes 0.6%, the smallest three roughly 0.55–0.73% each).
I want to flag something about this regression before drawing conclusions from it: the model’s overall R² is essentially 1 (0.99998). That’s not a sign of an unusually strong relationship — it’s a sign that RSF’s overall score is very close to a deterministic function of these five sub-indicators. In other words, this regression is largely recovering RSF’s own aggregation formula, not discovering an independent causal relationship. The relative sizes of the coefficients still tell us something useful — how heavily RSF’s own methodology weights safety relative to the other dimensions — but “safety matters most structurally” should be read as “RSF’s formula weights safety most heavily,” not as an external validation of safety’s importance.
Event versus structure
Put the two results side by side and there’s an apparent tension: political context is the dimension that changed the most in 2023–2024, but safety is the dimension the aggregation formula weights most heavily overall. Both are true, and they’re not actually in conflict — they’re answering different questions.
Political context had an unusually large, one-year move relative to its typical year-to-year variation. That’s what makes 2023–2024 a political crisis in the descriptive sense: this is where the year-over-year change was concentrated. Safety, meanwhile, carries more weight in RSF’s formula for computing the score in the first place, but it didn’t move much this particular year — so its structural weight didn’t translate into much change. A dimension can be structurally important and still contribute little to a given year’s swing, if it simply doesn’t move that year.
Practically, I’d draw two different implications from that: short-term monitoring should track political developments, because that’s where year-to-year crises are showing up; but a country’s long-term score depends more on maintaining safety for journalists than on any other single dimension, even in years when safety isn’t in the news.
This framework also explains something that might otherwise look like an inconsistency across posts in this series. In the overview post, I noted that RSF’s 2026 Index singled out the legal indicator as the sharpest mover of the year — deteriorating in over 60% of countries, driven by the criminalization of journalism through national security and defamation law. Here, for 2023–2024, it’s political context that moved the most. These aren’t competing claims about which dimension “really” matters; they’re the same event-versus-structure logic applied to two different years. The dimension that dominates a given year’s change — political in 2023–2024, legal in 2025–2026 — shifts with whatever’s driving that year’s news. Safety’s structural weight in the aggregation formula doesn’t shift nearly as much, because it reflects how RSF’s scoring method combines the five indicators generally, not what happened in any single year.
Regional patterns worth noting
EU & Balkans stayed the most stable zone across both political context and safety — consistent with its position throughout this whole series.
Americas had a real political decline but partially offsetting safety gains, which is visible directly in the decomposition chart above.
Asia-Pacific and Eastern Europe & Central Asia show the least favorable combination: political decline and safety decline in the same direction, rather than one offsetting the other.
Middle East & North Africa declined across nearly every dimension, extending an already low baseline rather than showing a distinct new pattern.
Two crises, two different shapes
Lining this post up against the last one, the contrast is fairly stark. 2021–2022 was, by RSF’s own account, about information chaos and geopolitical conflict, spread across several distinct mechanisms that a single aggregate score obscured — and I could only reconstruct it qualitatively, because the sub-indicators weren’t published that year. 2023–2024 is more directly measurable: political context moved further and more consistently than anything else, in a year when RSF itself pointed to direct government hostility toward the press, an unusually large global election cycle, and continued economic strain on independent media.
I don’t think either crisis is a template for whatever comes next. The value of having pressfreedom.data maintained and queryable isn’t that it predicts the next decline — it’s that when the next one happens, I’ll be able to ask exactly this kind of question again, with whatever data RSF actually publishes that year, instead of starting from scratch.
If you’d like to check any of these numbers yourself, the Shiny app has the full country-level data and lets you rerun this kind of comparison for any pair of years.